Exploring external contributions to the R codebase used by Roche to design and analyse late-stage clinical trials
Author
Affiliation
James Black, PhD
Data & Statistical Sciences, Roche
Published
March 12, 2024
Abstract
R is increasingly used in the pharmaceutical industry as the backbone for the pan-study codebase for the design and analysis of clinical trials. In parrallel with this shift to R, many companies are open sourcing, and collaborating, on the post-competitive code used across studies. The Pharmaverse and openstatsware are two example initiatives for statistical programming, and biostatistics, respectivly.
Whlie numerous benefits come from companies open sourcing their R codebase, from better talent acquisition, to transperancy with regulators, activity on git repos provides an insight into the return on investment (ROI) from external contributions to the codebase a company depends on. In this document we explore the ROI as assessed via external contributions to the late-stage codebase at Roche, shedding light on the tangible benefits derived from collaborative development in the pharmaceutical domain.
Keywords
Open Source, Pharmaverse, openstatsware
Document is currently a draft
This is a working document, and is not yet ready for public consumption.
In [1]:
library(glue)library(dplyr)
Attaching package: 'dplyr'
The following objects are masked from 'package:stats':

    filter, lag
The following objects are masked from 'package:base':

    intersect, setdiff, setequal, union
The following object is masked from 'package:GitStats':

    reset
The following object is masked from 'package:dplyr':

    pull
library(tidyr)
In [2]:
new_data <-FALSE# Google sheets data ----------------------------------------------------------# gsheet id sheet_id <-"1EV145GdYKTuYkOvwxIeWIINwGZkb-oi6ZLCq7d5xFRM"# Roche people, alongside their github handles roche_people <- googlesheets4::read_sheet(sheet_id, "roche-peeps")
ℹ Suitable tokens found in the cache, associated with these emails:
• 'james.black.jb2@roche.com'
• 'james@epijim.uk'
Defaulting to the first email.
! Using an auto-discovered, cached token.
  To suppress this message, modify your code or options to clearly consent to
  the use of a cached token.
See gargle's "Non-interactive auth" vignette for more details:
✔ Reading from "Roche Pharmarverse contributors + packages".
✔ Range ''roche-pharmaverse''.
# roche github handles as vector roche_gh_handles <-na.omit(roche_people$gh_username)# Roche people, via the emails in their gitconfig roche_gitconfig <- googlesheets4::read_sheet(sheet_id, "git-author") |>na.omit() |>left_join( roche_people,by =c("gh_username") )
✔ Reading from "Roche Pharmarverse contributors + packages".
✔ Range ''git-author''.
New names:
• `` -> `...3`
• `` -> `...4`
if (new_data){## Git Stats -----------------------------------------------------# git_stats <- create_gitstats() %>%# set_host(# api_url = "https://api.github.com",# orgs = {# roche_pharmaverse |> # filter(platform == "github.com") |> # pull(org) |> # unique()# }# ) %>%# set_host(# api_url = "https://code.roche.com.com/api/v4",# orgs = {# roche_pharmaverse |> # filter(platform == "code.roche.com") |> # pull(org) |> # unique()# }# ) # # ## All repos # pull_repos(git_stats)# pull_commits(git_stats, date_from = as.Date("2010-01-01"), date_until = Sys.Date() )# # repos <- get_repos(git_stats)# commits <- get_commits(git_stats) ## Git Commit Stats ----------------------------------------------------------- all_commits <- GithubMetrics::gh_commits_get(paste0(roche_pharmaverse$org,"/",roche_pharmaverse$name), days_back =365*10 ) cleaned_commits <- all_commits |># Add windows left_join( roche_people |>filter(!is.na(gh_username)),by =c("author"="gh_username") ) |># Just packages from Rochefilter(full_name %in% roche_pharmaverse$full_name) |># Is a Roche personmutate(commit_date =as.Date(datetime),# if only start date, set last day to tomorrow`Roche end`=case_when(!is.na(`Roche start`) &is.na(`Roche end`) ~Sys.Date() +1,TRUE~`Roche end` ),# if only end date, set start day to earliest commit`Roche start`=case_when(is.na(`Roche start`) &!is.na(`Roche end`) ~min(as.Date(all_commits$datetime)),TRUE~`Roche start` ),# No set if commit is Roche or notis_ours =case_when(is.na(`Roche start`) &tolower(author) %in%tolower(roche_gh_handles) ~"Roche", commit_date >`Roche start`& commit_date <`Roche end`&tolower(author) %in%tolower(roche_gh_handles) ~"Roche",grepl("roche.com", commit_email, fixed =TRUE) ~"Roche",TRUE~"External" ) ) %>%# Add which namespaceleft_join( roche_pharmaverse |>select(full_name, namespace),by ="full_name") saveRDS(cleaned_commits, "cache/cleaned_commits.rds") gh_usernames_status <- cleaned_commits |>select(author, is_ours) %>%unique() ## Who is there# cleaned_commits |># group_by(author, full_name, is_ours) |># summarise(n = n()) |> unique() # Git lines of code -----------------------------------------------------------# Pull repos down and do a git blame repo <- roche_pharmaverse$full_name[1] data_lines <-NULLfor(repo in roche_pharmaverse$full_name){message(repo) path <-file.path(tempfile(pattern=repo))dir.create(path, recursive=TRUE)#output <- clone(glue("https://github.com/{repo}"), path, progress = FALSE)system(glue("git clone https://github.com/{repo} {path}"))system(glue("cd {path} && {getwd()}/contributors.sh"))file.copy(from =glue("{path}/temp.csv"), to ="temp.csv",overwrite =TRUE) temp <- readr::read_table("temp.csv", col_names =FALSE) i_data <-bind_cols( temp %>%select(lines = X1), temp %>%select(-X1,-X2) |> tidyr::unite("person",1:(ncol(temp)-2),sep=" ") |>mutate(person =gsub(x = person,replacement ="",pattern =" NA",ignore.case =FALSE) ) ) |>mutate(repo = repo) data_lines <-bind_rows( i_data, data_lines ) }saveRDS(data_lines,"cache/cleaned_lines.rds")## Get issues data from github ------------------------------------------------ issues <- GithubMetrics::gh_issues_get( roche_pharmaverse$full_name, days_back =30*12 ) comments <- GithubMetrics::gh_issues_comments_get( roche_pharmaverse$full_name, days_back =30*12) issues_cleaned <-left_join( comments %>%select( full_name, issue_number,comment_created = created,comment_body = body,comment_author = author ), issues,by =c("full_name","issue_number") ) |>filter(comment_author !="github-actions[bot]") |>mutate(Package =basename(full_name) ) |>left_join( roche_pharmaverse |>select(name, namespace),by =c("Package"="name") )} else { data_lines <-readRDS("cache/cleaned_lines.rds") cleaned_commits <-readRDS("cache/cleaned_commits.rds") issues_cleaned <-readRDS("cache/issues_cleaned.rds")}
1 Background
In July 2021, Roche stopped development with propriety statistical software, to focus on a new backbone of R packages for the analysis of clinical trials. A 10+-year old codebase written in a propriety language (named STREAM) went into maintenance only updates, and development resources were shifted in their entirety to the new R backboned codebase, that comprised rOAK, admiral(Straub et al. 2023) and NEST(NEST 2023), which form the core of the pharmaverse(pharmaverse 2023). The design of clinical trials and exploratory data analysis at Roche has a longer history of R use, with a packages like rpact(Anders Bilgrau and Krøgholt 2023) and crmPack(Sabanés Bové et al. 2019) used for many years. This has continued to increase in recent years through initiatives like openstatsware(openstatsware 2023), that aim to collaboratively fill software gaps in clinical trial design as open source software.
1.1 Aim
In this document we explore the ROI from the perspective of an organisation, from both qualitive and quantative assessments, shedding light on the tangible benefits derived from collaborative development in the pharmaceutical domain.
2 Qualitative analysis
Regardless of whether a company open sources it’s own code, with our industries away from proprietary languages we are likely to be both depending on and extending open source software. A core question is then whether there is an added benefit open sourcing our own code, and actively contributing back to projects we use.
2.1 PHUSE guidance
The PHUSE Open Source Guidance(PhUSE 2023) document outlines the benefits of open source across 3 main points:
Code used in clinical reporting is about the summation and presentation of insights where the process of how they were generated should be transparent. The guidance refers to this code as ‘post-competitive’ intellectual property.
The creation of ADaM datasets and TFLs is a process that is repeated across companies, so there is the opportunity to co-create with a common goal.
Open source software ensure outputs are reproducible without needing to purchase a licence.
Post-competitive intellectual property is a term defined in the guidance as:
A less common term we have defined to be where code collaboration improves the efficency of insights, rather than the creation of insights that would otherwise not be possible. In the context of PHUSE collaborators, this includes packages that take CDISC data and apply templated data steps and visualizations to prepare a CSR, like those seen in the pharmaverse.
2.2 Increasing acceptance
A rising tide lifts all boats embodies a position Roche took in the early days of open sourcing, with the specific intent that by open sourcing our code, and collaborating with companies, we could help regulators and our industry gain confidence in the use of open source software regardless of whether we saw external contributions back onto the code we released.
This was a strategy that worked across three layers;
Open sourcing our own code, and contributing to other projects we leverage
Meaningful support for pharma specific packages
Examples include allowing allocating sufficient time for employees to contribute to the codebase as a core of ‘how we work’, and the creation of a dedicated team to support the pharmaverse packages like admiral and NEST, and active investment co-founding R/Pharma and it’s non-profit Open Source in Pharma(Pharma 2023)
Supporting the wider R community
Our pharma specific R code depends on non-industry specific R packages.
Examples include being a platinum member of the R Consortium(Consortium 2023), and the first Pharma to co-host useR!, the main global R conference.
2.3 Mitigating risks
2.3.1 PHUSE OS guidance
The PHUSE Open Source Guidance(PhUSE 2023) document highlights several risks from open sourcing code. Many of these can be directly countered, as shown in Table 1.
Table 1: Example risks with rebuttal
Risk statement
Rebuttal
We could be liable to end users
All licences Roche use have provisions in them that explicity state the code is
Opening up our code could risk our reputation if bugs are found
Ultimately this would be in the benefit of patients if we are made aware of ways to improve the code
Open sourcing is an unnecessary risk
The risk of leaking contents from prior code can be minimised by flattening the history of the repository before release
The main branch can be protected, and only allow changes through reviewed pull requests
2.3.2 EU CRA act
Another in-development complexity is the Cyber Resilience Act (Commission 2022), currently being discussed in the European Union. While we currently only have a draft of the new law, it is likely to have implications for the use and contributions to open source software by pharma companies.
Examples include;
Execute risk assessments, including vulnerability scanning
Have a policy and process for timely response to vulnerabilities
A ‘bill of materials’ summarising components used
To have this overseen by a ‘open-source software steward’, which if not roche could potentially be other entities like the R Consortium or PHUSE
2.4 Other benefits
Many of talent graduating today (or in the last 5 years) across quantative science degrees have R and/or Python experience, and are often motivated by the idea of using common open source languages, rather than the proprietary and banking/pharma languages of the past
We can share ideas, and get feedback from the wider community, allowing innovation to more easily impact across companies
We can more easily collaborate with other companies, and have a common language to discuss ideas and code
Talent can be more easily attracted to Roche, as they can see the contributions we make to the wider community, and the opportunities to work on open source projects
Talent can more easily flow between companies, as we share more of our ADaM and TLG code
As the code-base is version controlled with git, we are able to extract some information around who has made contributions, and what types of contributions those were. There are 20 packages in the pharmaverse relevant to Roche, and 6 packages from openstatsware. Across these packages, we have 203 Roche people working across 205 known Github user accounts.
In this analysis we can look at commits ( Section 3.2), lines of code (Section 3.3) and issues/commits (Section 3.4) to understand better how our code-base is influenced by individuals from outside of our own company.
3.1 Method
We maintain a list of Github handles of Roche employees used to contribute to pharmaverse packages we consider relevant to submissions within Roche or openstatsware packages used for statistical design or analysis.
The following known caveats exist with this analysis.
Some projects were started internally on our self-hosted git server, than migrated to github.com. This means we know the commit can be attributed to Roche, but we do not have Github user data attributed to commits generated when the project was internal only.
Some people have moved companies, but are still involved in the pharmaverse.
We are likely missing some Roche github handles, so true Roche contributions are likely to be higher.
When working with lines of code, some code is generated by scripts (e.g. devtools::document(), and so certain file-types are ignored) is automatically adding the majority of the code in the repo.
Commits are an indicator of contributions, and a single commit could range from adding key piece of functionality, to fixing a spelling mistake.
Our list of github handles of Roche employees may not be complete. Our data on when employed (if they joined or left Roche) is manually added, so may not be exact. Generated with 23332 commits from 2014-06-12 to 2023-12-28.
1 Person counted if ever employed by Roche, so contributions could occur while employed externally.
2 Where a person joined or left Roche, commits are assigned
to Roche only if employed when commit was made.
3 Trend in % Roche comments month to month. X axis is not fixed across packages.
3.3 Lines of code
This section looks at the lines of code per person present in the most recent version of the code. We exclude any code in the following folders in order to remove the risk of machine generated code skewing the results:
man/
misc/
inst/
data/
The number of people may differ, as in this section we are using the information from the persons .gitconfig file, rather than the Github user account information.
3.3.1 Lines of code by package
This is currently inaccurate
This data source uses information from the git commits, so we are relying on defining whether a person is Roche or not based on what email was in their .gitconfig file (or gh account if change made in github UI). This is currently very innacurate, so there are many false negatives where we miss Roche people contributing from a personal email account we do not know.
data_lines <-readRDS("cache/cleaned_lines.rds")data_lines |>mutate(person =gsub(".*\\+","",person),person =gsub("@users.noreply.github.com>","",person),person =gsub("<","",person),person =gsub(">","",person),person =gsub("@github.com","",person),# Is Rocheis_roche =case_when( person %in%unique(roche_people$gh_username) ~"Roche",endsWith(person, '@roche.com') ~"Roche",endsWith(person, '@gene.com') ~"Roche",TRUE~"External" ),Package =basename(repo) ) |>filter(!person %in%c("insights-engineering-bot","pharmaverse-bot") ) |>left_join( roche_pharmaverse |>select(name, url_repo, url_hex, namespace),by =c("Package"="name") ) |>group_by(namespace, repo, is_roche) |>summarise(lines =sum(lines), .groups ="drop" ) |>pivot_wider(names_from = is_roche, values_from = lines) |>mutate(`% Roche`=case_when(!is.na(Roche) ~ Roche/(Roche+External),TRUE~0 ) ) |>mutate(Package =basename(repo) ) |>select( namespace, Package, `% Roche` ) |>arrange(desc(`% Roche`) ) |>left_join( roche_pharmaverse |>select(name, url_repo, url_hex),by =c("Package"="name") ) |>mutate(Package = dplyr::case_when(!is.na(url_hex) ~ glue::glue("<img src='{url_hex}' height='24'></img> <a href='{url_repo}'>`{Package}`</a>"),TRUE~glue("<a href='{url_repo}'>`{Package}`</a>") ) ) |>select(-c(url_repo, url_hex)) |>group_by(namespace) |>gt() |>data_color(columns =c(`% Roche`),#rows = currency < 50,method ="numeric",palette =c("#F2D4FF","#007AC2"),domain =c(0, 1) ) |>tab_header(title ="Lines of code attributed to Roche authors",subtitle =md("Data comes from `git blame` of current package without `/docs`, `man` or `inst` folders") ) |>tab_source_note(source_note =md(glue("Our list of github handles of Roche employees may not be complete. Our data on when employed (if they joined or left Roche) is manually added, so may not be exact.") )) |>fmt_percent(columns =c(`% Roche`),decimals =0 ) |>tab_footnote(footnote =md("A line of code is attributed to Roche if the person *ever* worked for Roche. `xportr` is an example where lines of code were contributed before the person joined Roche's team."),locations =cells_column_labels(columns =`% Roche`) ) |>tab_options(row_group.background.color ="#FAC9B5" ) |>fmt_markdown(columns =c(Package))
Lines of code attributed to Roche authors
Data comes from git blame of current package without /docs, man or inst folders
Our list of github handles of Roche employees may not be complete. Our data on when employed (if they joined or left Roche) is manually added, so may not be exact.
1 A line of code is attributed to Roche if the person ever worked for Roche. xportr is an example where lines of code were contributed before the person joined Roche’s team.
3.4 Issues & Comments
Issues, and comments on issues, incorporates an additional form of collaboration that does not require writing code.
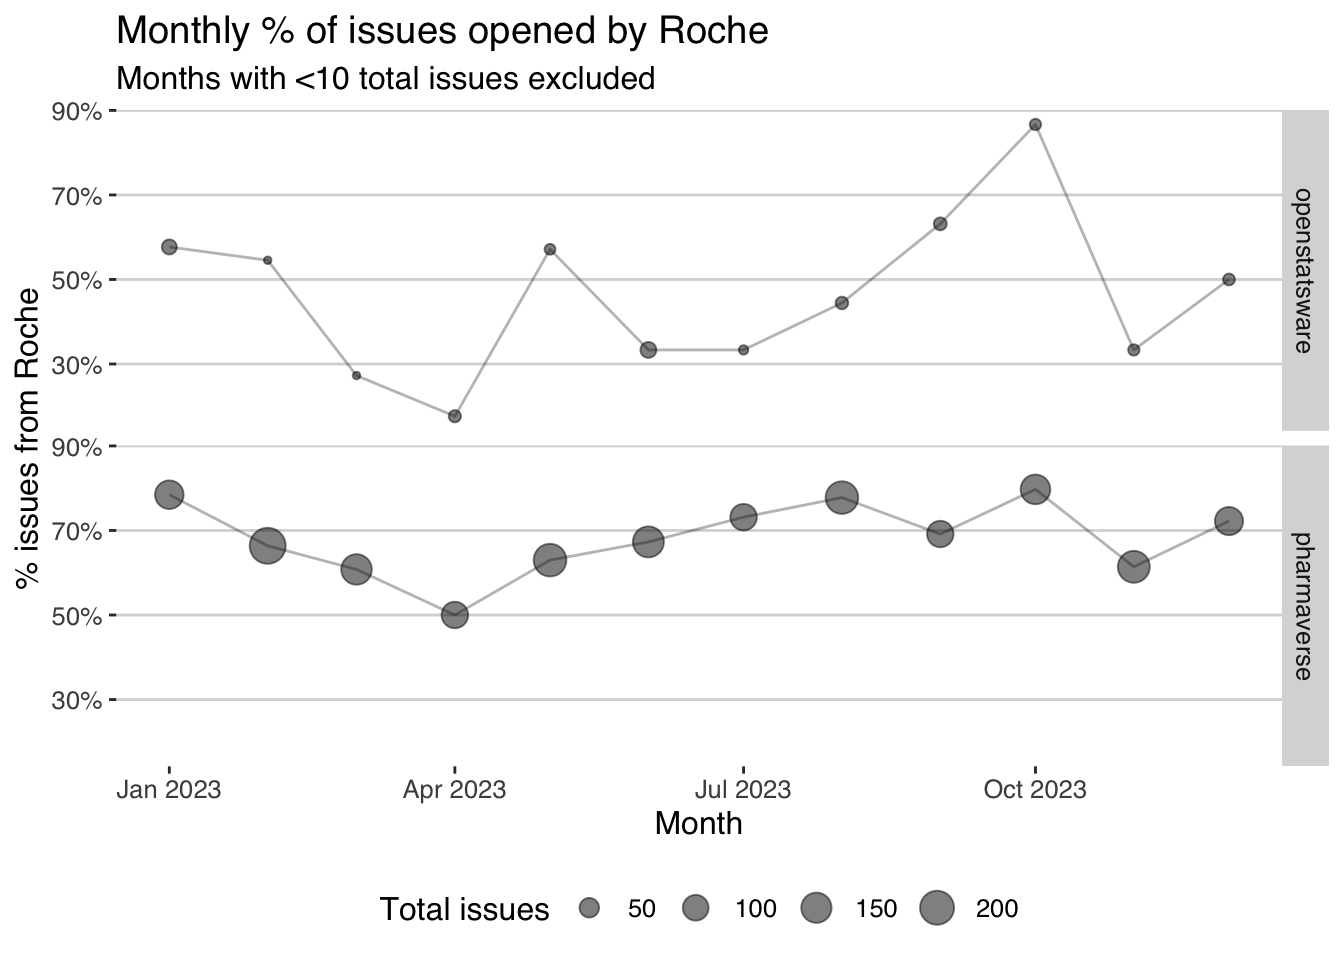
There are 1808 issues and 6165 comments in the pharmaverse. There are 205 issues and 1530 in open statsware.
issues_cleaned |>ungroup() |>left_join( roche_people |>select(gh_username, `Roche start`, `Roche end`) |>unique(),by =c("author"="gh_username") ) |>mutate(Month =as.Date(paste0(format(as.Date(comment_created), "%Y-%m"),"-01")),# No set if commit is Roche or notis_roche =case_when(is.na(`Roche start`) &tolower(author) %in%tolower(roche_people$gh_username) ~"Roche", created >`Roche start`& created <`Roche end`&tolower(author) %in%tolower(roche_people$gh_username) ~"Roche",TRUE~"External" ) ) |>group_by(namespace, Month) |>summarise(commits_roche =sum(is_roche =="Roche"),commits_all =n() ) |>ungroup() |>filter(commits_all >=10) |>mutate(`% comments from Roche`= commits_roche/commits_all ) |>ggplot(aes(x=Month, y=`% comments from Roche`)) +geom_line(alpha =0.3)+geom_point(aes(size = commits_all), alpha =0.5) + ggthemes::theme_hc() +facet_grid(rows =vars(namespace)) +scale_y_continuous(labels = scales::percent_format(accuracy =1)) +labs(title ="Monthly % of issue comments from Roche",subtitle ="Months with <10 total comments excluded",size ="Total comments" )
`summarise()` has grouped output by 'namespace'. You can override using the
`.groups` argument.
issues_cleaned |>ungroup() |>group_by(url) |>slice(1) |>left_join( roche_people |>select(gh_username, `Roche start`, `Roche end`) |>unique(),by =c("author"="gh_username") ) |>mutate(Month =as.Date(paste0(format(as.Date(comment_created), "%Y-%m"),"-01")),# No set if commit is Roche or notis_roche =case_when(is.na(`Roche start`) &tolower(author) %in%tolower(roche_people$gh_username) ~"Roche", created >`Roche start`& created <`Roche end`&tolower(author) %in%tolower(roche_people$gh_username) ~"Roche",TRUE~"External" ) ) |>group_by(namespace, Month) |>summarise(commits_roche =sum(is_roche =="Roche"),commits_all =n() ) |>ungroup() |>filter(commits_all >=10) |>mutate(`% issues from Roche`= commits_roche/commits_all ) |>ggplot(aes(x=Month, y=`% issues from Roche`)) +geom_line(alpha =0.3)+geom_point(aes(size = commits_all), alpha =0.5) + ggthemes::theme_hc() +facet_grid(rows =vars(namespace)) +scale_y_continuous(labels = scales::percent_format(accuracy =1)) +labs(title ="Monthly % of issues opened by Roche",subtitle ="Months with <10 total issues excluded",size ="Total issues" )
`summarise()` has grouped output by 'namespace'. You can override using the
`.groups` argument.
3.4.2 Issues and comments by package
left_join(# Issues data ------------------------------------------------------------ issues_cleaned |>left_join( roche_people |>select(gh_username, `Roche start`, `Roche end`) |>unique(),by =c("author"="gh_username") ) |>mutate(created =as.Date(created),# No set if commit is Roche or notis_roche =case_when(is.na(`Roche start`) &tolower(author) %in%tolower(roche_people$gh_username) ~"Roche", created >`Roche start`& created <`Roche end`&tolower(author) %in%tolower(roche_people$gh_username) ~"Roche",TRUE~"External" ) ) |>group_by(Package,issue_number) |>slice(1) |>group_by(Package) |>summarise(Issues =n(),Roche =sum(is_roche =="Roche"),`% Issues`= Roche/Issues, .groups ="drop" ) |>select( Package, Issues, `% Issues` ),# Comments data ------------------------------------------------------------ issues_cleaned |>left_join( roche_people |>select(gh_username, `Roche start`, `Roche end`) |>unique(),by =c("author"="gh_username") ) |>mutate(created =as.Date(comment_created),# No set if commit is Roche or notis_roche =case_when(is.na(`Roche start`) &tolower(author) %in%tolower(roche_people$gh_username) ~"Roche", created >`Roche start`& created <`Roche end`&tolower(author) %in%tolower(roche_people$gh_username) ~"Roche",TRUE~"External" ) ) |>group_by(Package) |>summarise(Comments =n(),Roche =sum(is_roche =="Roche"),`% Comments`= Roche/Comments, .groups ="drop" ) |>select( Package, Comments, `% Comments` ),by ="Package" ) |>## End of making two datasets# Join with pharmaverse dataleft_join( roche_pharmaverse |>select(name, url_repo, url_hex, namespace),by =c("Package"="name") ) |>group_by(namespace) |># Make a trend for Commentsleft_join( issues_cleaned |>left_join( roche_people |>select(gh_username, `Roche start`, `Roche end`) |>unique(),by =c("author"="gh_username") ) |>mutate(created =as.Date(comment_created),Monthly =format(as.Date(comment_created), "%Y-%m"),# No set if commit is Roche or notis_roche =case_when(is.na(`Roche start`) &tolower(author) %in%tolower(roche_people$gh_username) ~"Roche", created >`Roche start`& created <`Roche end`&tolower(author) %in%tolower(roche_people$gh_username) ~"Roche",TRUE~"External" ) ) |>group_by(full_name, Monthly) |>summarise(`Roche commits`=sum(is_roche =="Roche"),Commits =n() ) %>%mutate(Package =basename(full_name),`% Comments`=`Roche commits`/Commits ) |>arrange(Monthly) %>%summarise(`Comments trend`=list(`% Comments`), .groups ="drop" ) |>ungroup() |>mutate(Package =basename(full_name) ) |>select( Package, `Comments trend` ),by ="Package" ) |># Make a trend for issuesleft_join( issues_cleaned |>group_by(url) |>slice(1) |>left_join( roche_people |>select(gh_username, `Roche start`, `Roche end`) |>unique(),by =c("author"="gh_username") ) |>mutate(created =as.Date(comment_created),Monthly =format(as.Date(comment_created), "%Y-%m"),# No set if commit is Roche or notis_roche =case_when(is.na(`Roche start`) &tolower(author) %in%tolower(roche_people$gh_username) ~"Roche", created >`Roche start`& created <`Roche end`&tolower(author) %in%tolower(roche_people$gh_username) ~"Roche",TRUE~"External" ) ) |>group_by(full_name, Monthly) |>summarise(`Roche commits`=sum(is_roche =="Roche"),Commits =n() ) %>%mutate(Package =basename(full_name),`% Issues`=`Roche commits`/Commits ) |>arrange(Monthly) %>%summarise(`Issues trend`=list(`% Issues`), .groups ="drop" ) |>ungroup() |>mutate(Package =basename(full_name) ) |>select( Package, `Issues trend` ),by ="Package" ) |># Format Packagemutate(Package = dplyr::case_when(!is.na(url_hex) ~ glue::glue("<img src='{url_hex}' height='24'></img> <a href='{url_repo}'>`{Package}`</a>"),TRUE~glue("<a href='{url_repo}'>`{Package}`</a>") ) ) |>select(-c(url_repo, url_hex)) |>select(namespace, Package, Issues, Comments, `% Issues`,`Issues trend`, `% Comments`,`Comments trend`) |>gt() |>data_color(columns =c(`% Issues`,`% Comments`),#rows = currency < 50,method ="numeric",palette =c("#F2D4FF","#007AC2"),domain =c(0, 1) ) |>tab_header(title ="Issue and Comments from Roche vs External collaborators",subtitle =md("Data is captured going back 12 months only.") ) |>tab_source_note(source_note =md(glue("Our list of github handles of Roche employees may not be complete. Our data on when employed (if they joined or left Roche) is manually added, so may not be exact.") )) |>fmt_percent(columns =c(`% Issues`,`% Comments`),decimals =0 ) |>tab_options(row_group.background.color ="#FAC9B5" ) |>tab_spanner(label ="Roche + Externals",columns =c(Issues, Comments) ) |>tab_spanner(label ="Roche",columns =c(`% Issues`,`Issues trend`, `% Comments`, `Comments trend`) ) |>fmt_markdown(columns =c(Package)) |>gt_plt_sparkline(`Comments trend`,label =FALSE, same_limit =TRUE,palette =c("black", rep("transparent", 4)) ) |>gt_plt_sparkline(`Issues trend`,label =FALSE, same_limit =TRUE,palette =c("black", rep("transparent", 4)) ) |>tab_footnote(footnote =md("Trend in % coming from Roche over last 12 months."),locations =cells_column_labels(columns =c(`Issues trend`, `Comments trend`)) )
`summarise()` has grouped output by 'full_name'. You can override using the
`.groups` argument.
`summarise()` has grouped output by 'full_name'. You can override using the
`.groups` argument.
`geom_line()`: Each group consists of only one observation. ℹ Do you need to
adjust the group aesthetic?
`geom_line()`: Each group consists of only one observation. ℹ Do you need to
adjust the group aesthetic?
`geom_line()`: Each group consists of only one observation. ℹ Do you need to
adjust the group aesthetic?
Issue and Comments from Roche vs External collaborators
Our list of github handles of Roche employees may not be complete. Our data on when employed (if they joined or left Roche) is manually added, so may not be exact.
1 Trend in % coming from Roche over last 12 months.
4 Discussion
5 References
Anders Bilgrau, James Black, Estella Dong, and Tobias Krøgholt. 2023. “Rpact: Confirmatory Adaptive Clinical Trial Design and Analysis.” 2023. https://www.rpact.org.
Sabanés Bové, Daniel, Wai Yin Yeung, Giuseppe Palermo, and Thomas Jaki. 2019. “Model-Based Dose Escalation Designs in R with crmPack.”Journal of Statistical Software 89 (10): 1–22. https://doi.org/10.18637/jss.v089.i10.
Straub, Ben, Stefan Bundfuss, Jeffrey Dickinson, Ross Farrugia, Adam Forys, G Gayatri, Daphne Grasselly, et al. 2023. Admiral. https://pharmaverse.github.io/admiral/.