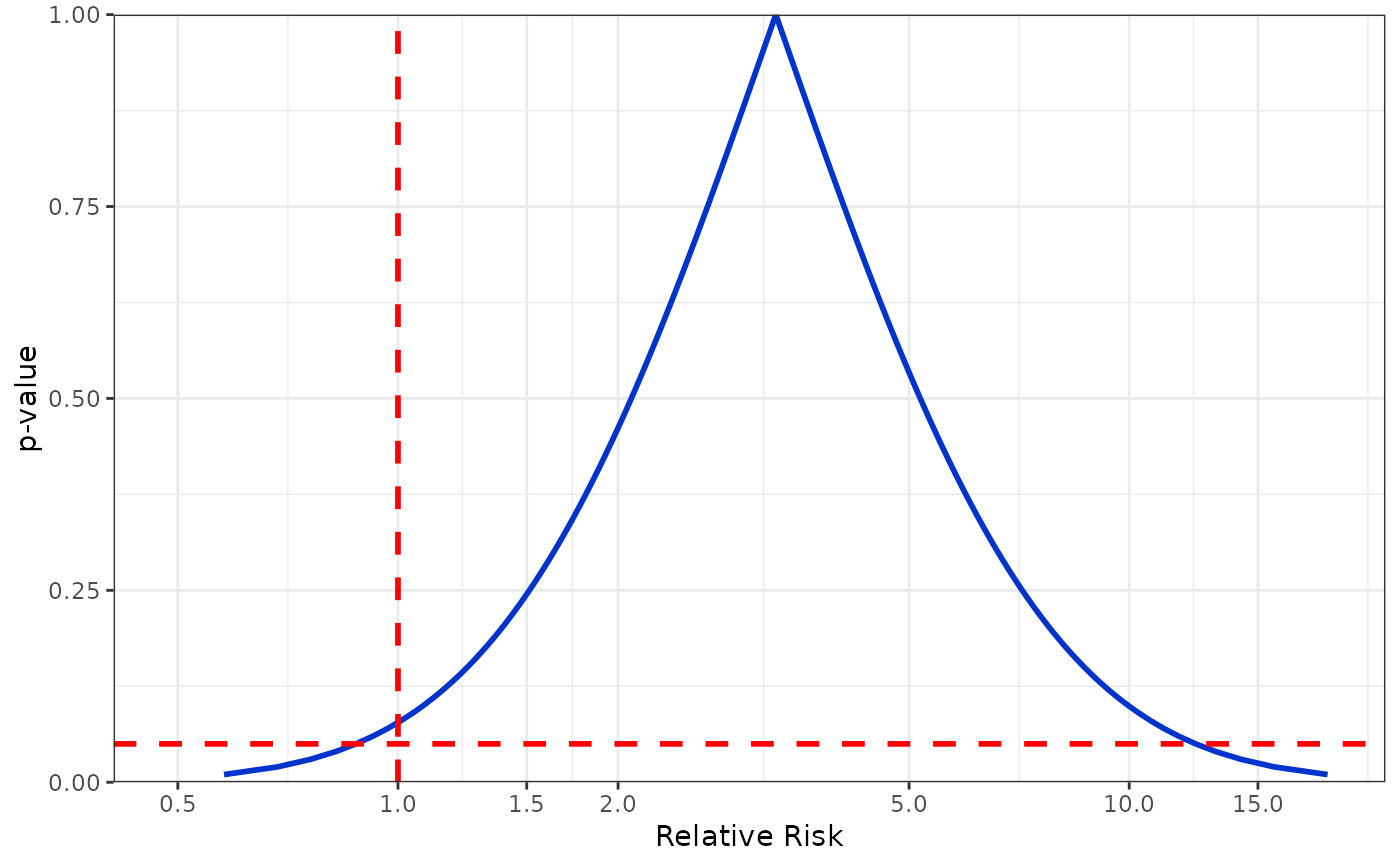
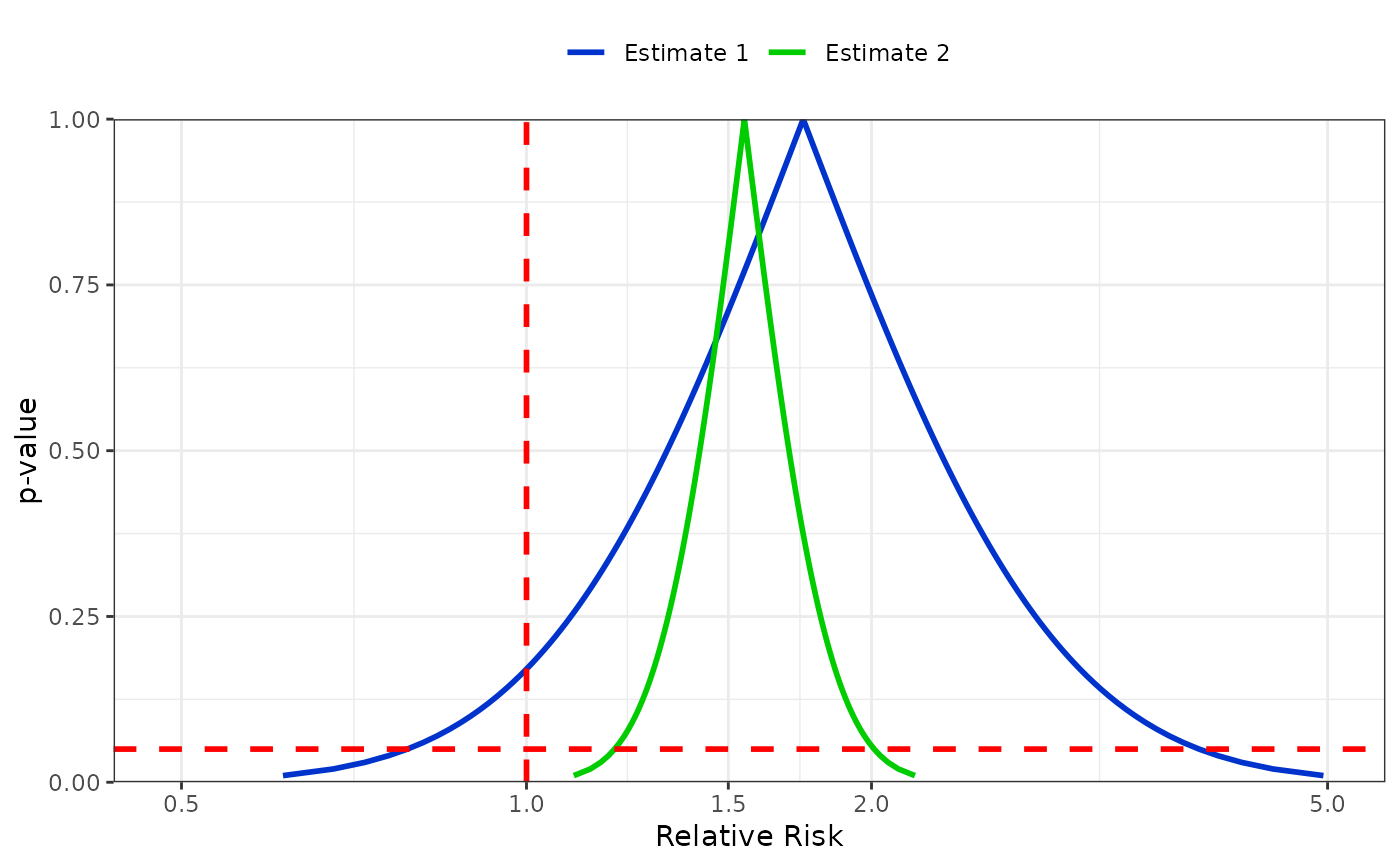
Plot the p-value function for one or two confidence interval pairs. See following for example of the use in the literature: Is flutamide effective in patients with bilateral orchiectomy? Rothman, Kenneth J et al. The Lancet , Volume 353 , Issue 9159 , 1184
pvalueplot(est1.ll, est1.ul, est2.ll = NA, est2.ul = NA,
  label1 = "Estimate 1", label2 = "Estimate 2",
  xlabel = "Relative Risk", citype = "95%CI", labelsize = NULL,
  functionwidth = 1, referencewidth = 1)
Arguments
- est1.ll
Lower confidence interval of estimate 1
- est1.ul
Upper confidence interval of estimate 1
- est2.ll
Lower confidence interval of estimate 2 (optional)
- est2.ul
Upper confidence interval of estimate 2 (optional)
- label1
If using two estimates, name the 1st
- label2
If using two estimates, name the 2nd
- xlabel
The x axis label
- citype
Choose between '95%CI', '90%CI' or '99%CI'
- labelsize
Change size of labels
- functionwidth
Change width of pvalue function line
- referencewidth
Change width of reference lines
Bugs
Code repo: https://github.com/epijim/episheet
Examples
pvalueplot(
  est1.ll = 0.9,
  est1.ul = 12,
  xlabel = "Relative Risk"
)
#> Confidence interval type is  95%CI


pvalueplot(
  est1.ll = 0.8,
  est1.ul = 3.8,
  est2.ll = 1.2,
  est2.ul = 2,
  label1 = "Estimate 1",
  label2 = "Estimate 2",
  xlabel = "Relative Risk",
  citype = "95%CI"
)
#> Confidence interval type is  95%CI
